Sports Software Market Size, Share and Forecast 2026 to 2035
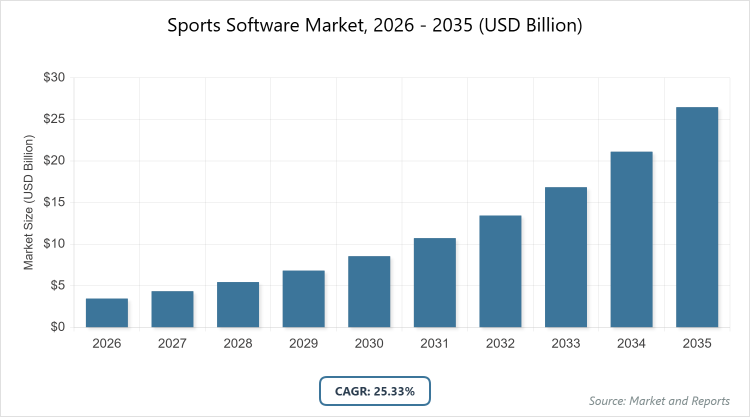
According to our latest research, the global sports software market is projected to grow from USD 3.47 billion in 2026 to USD 26.48 billion by 2035, growing at a CAGR is estimated at 25.33% during 2026-2035. The Sports Software Market is primarily driven by the surging demand for data-driven performance analytics and the integration of AI-powered wearables, which enable professional and amateur organizations to optimize athlete health, refine tactical strategies, and personalize fan engagement.
What are the Key Insights into the Sports Software Market?
- Global market value projected to reach USD 26.48 billion by 2035 from USD 3.47 billion in 2026.
- Compound Annual Growth Rate (CAGR) estimated at 25.33% during 2026-2035.
- Solution dominates the component segment.
- Cloud dominates the deployment segment.
- Football dominates the sport segment.
- On-Field dominates the type segment.
- Team Performance Analysis dominates the application segment.
- North America dominates the regional market.
What is the Sports Software Market?
Industry Overview
The sports software market refers to digital solutions designed to enhance various aspects of sports management, performance analysis, fan engagement, and operational efficiency within the sports industry. This includes software for team and player analytics, coaching tools, event management, ticket sales, fan interaction platforms, and virtual training systems, leveraging technologies like AI, machine learning, and IoT to provide real-time data insights, predictive modeling, and personalized experiences. These tools are used by professional teams, leagues, coaches, athletes, and sports organizations to optimize strategies, improve player health, boost revenue through fan loyalty programs, and streamline administrative tasks.
The market bridges traditional sports practices with modern technology, addressing needs for data-driven decision-making in a global industry where digital transformation is key to competitiveness, fan retention, and revenue growth, while also supporting amateur and esports sectors with scalable, cloud-based applications.
What are the Market Dynamics in the Sports Software Market?
Growth Drivers
The sports software market is driven by the increasing adoption of data-driven insights in sports, fueled by advancements in AI and machine learning for performance optimization and injury prevention, alongside the rise of wearable technologies that generate vast amounts of player data requiring sophisticated analysis tools. The growth of esports and fantasy sports platforms has heightened demand for real-time analytics and fan engagement software, while international sporting events encourage investments in technology for enhanced broadcasting and viewer experiences. Government support for digital infrastructure and partnerships between tech firms and sports leagues further accelerate growth, enabling scalable solutions that improve operational efficiency and revenue streams for organizations.
Restraints
Restraints in the sports software market include high implementation costs for advanced AI and cloud-based systems, which can limit adoption among smaller teams or organizations in developing regions, compounded by data privacy concerns under regulations like GDPR that require robust security measures and increase development expenses. Integration challenges with existing hardware and legacy systems hinder seamless deployment, while the lack of standardized data formats across sports disciplines leads to interoperability issues. Additionally, resistance from traditional coaching methods and a shortage of skilled analysts can slow market penetration.
Opportunities
Opportunities lie in the expansion of AI-driven predictive analytics for amateur and youth sports, where affordable cloud solutions can democratize access to professional-level tools, alongside integrations with 5G for real-time data processing in live events. Emerging markets in Asia-Pacific offer growth potential through rising sports investments and digital adoption, while collaborations with wearable manufacturers can create comprehensive ecosystems for health monitoring. The focus on fan engagement through AR/VR software opens avenues for monetization in esports, and sustainability initiatives can drive the development of eco-friendly data centers supporting software operations.
Challenges
Challenges include navigating stringent data privacy regulations that vary by region, requiring constant updates to compliance features, which raise costs, alongside cybersecurity threats to sensitive player and fan data that could erode trust. Rapid technological evolution demands ongoing R&D to keep software relevant, while economic uncertainties in sports funding can delay investments. Moreover, ensuring equitable access in underrepresented regions poses hurdles, necessitating inclusive strategies to address digital divides and maintain market inclusivity.
Sports Software Market: Report Scope
| Report Attributes | Report Details |
| Report Name | Sports Software Market |
| Market Size 2025 | USD 3.47 Billion |
| Market Forecast 2035 | USD 26.48 Billion |
| Growth Rate | CAGR of 25.33% |
| Report Pages | 220 |
| Key Companies Covered | IBM, SAS, SAP, Oracle, STATS Perform, Catapult Sports, and Zebra Technologies |
| Segments Covered | By Component, By Deployment, By Sport, By Type, By Application, By Region |
| Regions Covered | North America, Europe, Asia Pacific (APAC), Latin America, The Middle East and Africa (MEA) |
| Base Year | 2025 |
| Historical Year | 2020 – 2024 |
| Forecast Year | 2026 – 2035 |
| Customization Scope | Avail customized purchase options to meet your exact research needs. |
What is the Market Segmentation Analysis for the Sports Software Market?
The sports software market is segmented by component, deployment, sport, type, application, and region.
By component segment, Solution emerges as the most dominant subsegment, followed by Service as the second most dominant. Solution leads due to its core role in providing software platforms for analytics, management, and engagement, driven by demand for integrated tools that offer real-time insights and scalability in data-heavy sports environments; this dominance drives the market by enabling end-to-end digital transformations, attracting investments in AI enhancements, and facilitating partnerships that expand functionality, thereby increasing adoption rates and revenue from subscriptions.
Service, including consulting and support, grows rapidly by ensuring successful implementations and customizations, contributing to market expansion through long-term client relationships and value-added expertise.
By deployment segment, Cloud stands out as the most dominant subsegment in the deployment segment, with On-Premise as the second most dominant. Cloud dominates owing to its flexibility, cost-effectiveness, and ability to support remote access and real-time updates, appealing to global teams and leagues requiring seamless data sharing; this leadership propels the market by lowering barriers for smaller organizations, enabling scalable solutions for growing data volumes, and integrating with IoT for enhanced features that drive innovation and broader penetration. On-Premise, preferred for data control in high-security scenarios, supports growth by catering to regulated environments, ensuring compliance and customization.
By sport segment, Football is the most dominant subsegment in the sport segment, followed by Cricket as the second most dominant. Football leads because of its global popularity and high-stakes leagues demanding advanced analytics for strategy and performance, supported by massive investments in data tools; this dominance accelerates market dynamics by generating high-volume demand, fostering tech integrations like wearables, and creating spillover effects to other sports through proven models that boost overall investment and growth. Cricket, as the fastest-growing sport, benefits from emerging markets and digital broadcasting, contributing via specialized software for match analysis.
By type segment, On-Field is the most dominant subsegment in the type segment, followed by Off-Field as the second most dominant. On-Field dominates due to its focus on real-time player tracking and game insights, essential for competitive advantage in live sports; this position drives the market by integrating with hardware like sensors, enabling predictive features, and attracting funding for R&D that expands applications and market value. Off-Field, covering fan and business analytics, grows through monetization opportunities, supporting holistic ecosystem development.
By application segment, Team Performance Analysis is the most dominant subsegment in the application segment, followed by Video Analysis as the second most dominant. Team Performance Analysis leads with its critical role in strategy optimization using data metrics, driven by professional leagues’ needs; this dominance propels the market by demanding AI tools, creating data ecosystems, and enabling revenue from subscriptions that fuel innovation and adoption. Video Analysis, for tactical reviews, contributes via accessibility enhancements for coaches.
What are the Recent Developments in the Sports Software Market?
- In Q2 2024, Stats Perform acquired Scout7, enhancing scouting and recruitment analytics capabilities for football clubs.
- In Q1 2025, Sportradar acquired Metrica Sports, integrating advanced video analysis tools for broader sports coverage.
- In Q2 2024, Zone7 raised $15 million in funding to expand AI-driven injury prediction software.
- In Q3 2025, SAS launched new athlete performance tools incorporating machine learning for real-time insights.
- In Q3 2024, SAP introduced a cloud-based analytics suite tailored for team management.
What is the Regional Analysis of the Sports Software Market?
- North America to dominate the market
North America holds the largest share of the sports software market at approximately 45%, driven by high investments in technology, a mature sports industry with major leagues like NFL and NBA, and strong innovation ecosystems; the United States dominates this region through companies like IBM and Oracle, supported by advanced R&D, government grants for digital sports, and widespread adoption in professional and collegiate sports, enabling data-driven strategies that enhance competitiveness and fan engagement amid a focus on monetization.
Europe represents about 30% of the market, emphasizing regulated data use and analytics in football leagues; Germany leads as the dominating country with its Bundesliga integrations and firms like SAP, fostering collaborations for performance tools across the EU, while the UK and France contribute through esports growth and event management software.
Asia Pacific is the fastest-growing region at around 20%, propelled by rising sports interest and digital investments; China dominates here with government-backed initiatives for AI in sports, alongside Australia focusing on cricket analytics, addressing large populations through scalable cloud solutions.
The Middle East and Africa, holding about 5%, show emerging potential via infrastructure developments; the UAE leads with investments in smart stadiums and software for events like Formula 1, supported by South Africa in rugby analytics.
Who are the Key Market Players and Their Strategies in the Sports Software Market?
- IBM employs AI integrations like Watson for fantasy sports and analytics, focusing on partnerships with leagues for data insights.
- SAS leverages statistical tools for athlete performance, pursuing R&D in ML for predictive modeling and acquisitions for expansion.
- SAP prioritizes cloud suites for team management, forming alliances with UEFA for customized analytics.
- Oracle concentrates on database solutions for real-time data, investing in esports through partnerships.
- STATS Perform adopts acquisitions like Scout7 for scouting enhancements, targeting football with video analysis.
- Catapult Sports focuses on wearables integration, expanding in athlete monitoring via global collaborations.
- Zebra Technologies utilizes tracking hardware-software hybrids, emphasizing NFL partnerships for on-field data.
What are the Market Trends in the Sports Software Market?
- Integration of AI/ML for predictive modeling and real-time insights in performance analysis.
- Adoption of wearable technology for metrics like heart rate and fatigue.
- Enhanced fan engagement via behavior data and personalized platforms.
- Growth in esports with AI for strategy and broadcasting.
- Cloud-based solutions for storage and backup.
- Focus on injury prevention through data analytics.
- Development of customized tools for amateur organizations.
- Partnerships for expanded capabilities in emerging regions.
What Market Segments are Covered in the Sports Software Market Report?
By Component
- Solution
- Service
By Deployment
- Cloud
- On-Premise
By Sport
- Football
- Cricket
- Baseball
- Rugby
- Others
By Type
- On-Field
- Off-Field
By Application
- Team Performance Analysis
- Video Analysis
- Health Assessment
- Data Interpretation & Analysis
- Fan Engagement & Digital Experience Analysis
- Others
By Region
- North America
- U.S.
- Canada
- Europe
- UK
- Germany
- France
- Rest of Europe
- Asia Pacific
- China
- India
- Japan
- Rest of Asia Pacific
- Latin America
- Brazil
- Mexico
- Rest of Latin America
- Middle East & Africa
- UAE
- South Africa
- Rest of Middle East & Africa
Chapter 1. Preface
Chapter 2. Executive Summary
Chapter 3. Global Sports Software Market - Industry Analysis
Chapter 4. Global Sports Software Market- Competitive Landscape
Chapter 5. Global Sports Software Market - Component Analysis
Chapter 6. Global Sports Software Market - Deployment Analysis
Chapter 7. Global Sports Software Market - Sport Analysis
Chapter 8. Global Sports Software Market - Type Analysis
Chapter 9. Global Sports Software Market - Application Analysis
Chapter 10. Sports Software Market - Regional Analysis
Chapter 11. Company Profiles
Frequently Asked Questions
Sports software comprises digital tools for analytics, management, engagement, and performance enhancement in sports, using AI and data for insights and efficiency.
Key factors include AI adoption, wearable tech, esports growth, data-driven decisions, and investments in digital infrastructure.
The market is projected to grow from USD 3.47 billion in 2026 to USD 26.48 billion by 2035.
The CAGR is estimated at 25.33% during 2026-2035.
North America will contribute notably, holding the largest share due to technological investments.
Major players include IBM, SAS, SAP, Oracle, STATS Perform, Catapult Sports, and Zebra Technologies.
The report provides market size, forecasts, segmentation, regional insights, key players, trends, dynamics, and developments.
The value chain includes software development, integration, deployment, data collection, analysis, and service support.
Trends are evolving toward AI/ML and cloud solutions, with preferences for real-time analytics and personalized engagement.
Regulatory factors include data privacy laws like GDPR, while environmental factors involve sustainable data centers for cloud operations.