Electric Bus Charging Station Market Size, Share and Trends 2026 to 2035
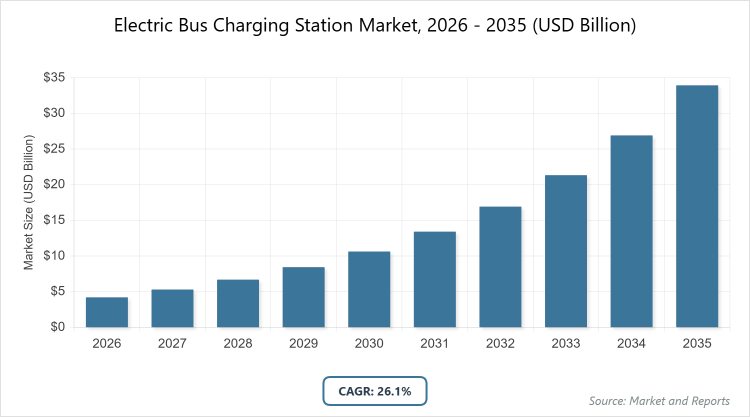
According to MarketnReports, the global Electric Bus Charging Station market size was estimated at USD 4.21 billion in 2025 and is expected to reach USD 42.81 billion by 2035, growing at a CAGR of 26.1% from 2026 to 2035. Electric Bus Charging Station Market is driven by increasing government initiatives for zero-emission public transport and rapid urbanization.
What is the Industry Overview of the Electric Bus Charging Station Market?
The Electric Bus Charging Station Market encompasses infrastructure solutions designed to recharge electric buses, including depot-based chargers, opportunity chargers along routes, and advanced wireless systems that enable efficient fleet operations while minimizing downtime. This market supports the global shift towards sustainable urban mobility by providing scalable, reliable charging networks that integrate with smart grids and renewable energy sources, addressing the challenges of high-power demands and fleet electrification.
It plays a pivotal role in reducing urban emissions and operational costs for transit agencies, with innovations in fast-charging technologies and software for energy management enhancing overall system efficiency. The market definition includes all hardware, software, and services related to electric bus charging, driven by regulatory pressures for cleaner transport and investments in public infrastructure to accommodate growing electric bus fleets worldwide.
What are the Key Insights into the Electric Bus Charging Station Market?
- The global Electric Bus Charging Station Market size was estimated at USD 4.21 Billion in 2025 and is expected to reach USD 42.81 Billion by 2035.
- Growing at a CAGR of 26.1% from 2026 to 2035.
- The Electric Bus Charging Station Market is driven by increasing government initiatives for zero-emission public transport, rapid urbanization, and advancements in battery technology reducing charging times.
- Dominated subsegment in Charging Type: Depot Charging with 55% share, because of its cost-effectiveness for overnight fleet charging, allowing full battery replenishment without interrupting daily operations.
- Dominated subsegment in Charger Type: Off-Board with 60% share, because of higher power delivery capabilities suitable for commercial fleets and integration with pantograph systems for quick top-ups.
- Dominated subsegment in Power Output: 151-450 kW with 45% share, because of balancing fast charging speeds with infrastructure costs, ideal for urban transit hubs.
- Dominated region: Asia Pacific with 50% share, because of massive electric bus deployments in China, supported by government subsidies and aggressive emission reduction targets.
What are the Market Dynamics of the Electric Bus Charging Station Market?
Growth Drivers
Growth drivers in the Electric Bus Charging Station Market include stringent environmental regulations mandating zero-emission vehicles in urban areas, compelling transit operators to electrify fleets and invest in supporting infrastructure. Substantial government subsidies and incentives, such as grants for charging installations and tax rebates, lower the financial barriers for adoption, accelerating market penetration. Advancements in charging technologies, including ultra-fast DC chargers and wireless systems, reduce downtime and enhance operational efficiency, making electric buses more viable for high-frequency routes.
The integration of renewable energy sources with smart grids optimizes energy use and reduces costs, appealing to sustainability-focused municipalities. Rising urbanization and public demand for cleaner air further drive investments, as cities expand public transport networks with electric solutions to combat pollution and congestion.
Restraints
Restraints in the Electric Bus Charging Station Market stem from high upfront costs for infrastructure development, including grid upgrades and high-power chargers, which strain budgets in developing regions. Grid capacity limitations in many areas hinder scalability, as simultaneous charging of large fleets can overload existing networks without significant reinforcements. Lack of standardization in charging protocols across manufacturers complicates interoperability and increases integration costs. Regulatory delays in permitting and approvals slow deployment timelines, particularly in densely populated urban zones. Economic uncertainties and fluctuating energy prices also pose challenges, as they affect long-term planning and return on investment for transit agencies transitioning from traditional fuels.
Opportunities
Opportunities in the Electric Bus Charging Station Market arise from emerging wireless and inductive charging technologies, which eliminate physical connectors and enable dynamic charging during operations, ideal for continuous-route buses. Partnerships between utilities and transit agencies can leverage vehicle-to-grid (V2G) capabilities, allowing buses to supply power back to the grid during peak times, creating new revenue streams. Expansion into emerging markets with growing urban populations offers untapped potential, supported by international funding for green infrastructure. Integration of AI and IoT for predictive maintenance and demand forecasting enhances system reliability and efficiency. The rise of autonomous electric buses presents avenues for specialized charging solutions, positioning innovators to capture niche segments in smart city initiatives.
Challenges
Challenges in the Electric Bus Charging Station Market include managing high power demands without causing grid instability, requiring advanced load management systems and substantial infrastructure investments. Achieving widespread interoperability among diverse bus models and charger types demands unified standards to avoid compatibility issues. Harsh weather conditions in certain regions can affect charging efficiency and equipment durability, necessitating robust, resilient designs. Cybersecurity threats to connected charging networks pose risks to operational safety and data privacy. Balancing rapid deployment with sustainable sourcing of materials for chargers and batteries adds complexity, as supply chain disruptions can delay projects and increase costs.
Electric Bus Charging Station Market: Report Scope
| Report Attributes | Report Details |
| Report Name | Electric Bus Charging Station Market |
| Market Size 2025 | USD 4.21 Billion |
| Market Forecast 2035 | USD 42.81 Billion |
| Growth Rate | CAGR of 26.1% |
| Report Pages | 220 |
| Key Companies Covered |
ABB Ltd., Siemens AG, Heliox Energy, ChargePoint Inc., Proterra Inc., Ekoenergetyka – Polska S.A., Electreon Wireless Ltd., Furrer+Frey AG, JEMA Energy SA, Alstom SA, and Others |
| Segments Covered | By Charging Type, By Charger Type, By Power Output, and By Region |
| Regions Covered | North America, Europe, Asia Pacific (APAC), Latin America, and The Middle East and Africa (MEA) |
| Base Year | 2025 |
| Historical Year | 2020 – 2024 |
| Forecast Year | 2026 – 2035 |
| Customization Scope | Avail customized purchase options to meet your exact research needs. |
How is the Market Segmentation Structured in the Electric Bus Charging Station Market?
The Electric Bus Charging Station market is segmented by charging type, charger type, power output, and region.
Based on Charging Type Segment. The most dominant segment is Depot Charging, which holds the largest market share due to its suitability for overnight fleet recharging in controlled environments, minimizing operational disruptions and allowing for lower-cost electricity during off-peak hours; this dominance drives the market by enabling cost-effective large-scale electrification of bus fleets, supporting extended daily ranges and attracting investments from transit agencies focused on efficiency. The second most dominant segment is Opportunity Charging, valued for quick top-ups at route endpoints or stops using pantographs; it contributes to market growth by facilitating continuous operation in high-demand urban routes, reducing battery size requirements, and enhancing overall system flexibility for dynamic transit needs.
Based on Charger Type Segment. The most dominant segment is Off-Board, accounting for the majority share owing to its ability to deliver high-power charging without adding weight to the bus, ideal for public infrastructure; this leads market growth by supporting faster recharge times and scalability in transit hubs, encouraging widespread adoption among operators. The second most dominant segment is On-Board, preferred for its integration directly into the vehicle for flexibility in various locations; it propels the market forward by enabling charging in remote or temporary setups, lowering infrastructure needs, and aiding expansion in regions with limited fixed stations.
Based on Power Output Segment. The most dominant segment is 151-450 kW, leading due to its optimal balance of speed and cost for commercial applications, suitable for mid-route boosts; this dominance fuels market expansion by meeting the demands of high-frequency bus services, improving turnaround times, and driving investments in urban electrification. The second most dominant segment is 50-150 kW, driven by affordability for depot installations; it aids growth by providing reliable overnight charging, supporting smaller fleets, and facilitating entry-level adoption in emerging markets.
What are the Recent Developments in the Electric Bus Charging Station Market?
- In September 2025, ABB announced the launch of its new Terra 184 charger, capable of delivering up to 360 kW for electric buses, enhancing fast-charging capabilities in urban transit systems.
- In July 2025, Siemens partnered with a major U.S. city to deploy 50 pantograph chargers for its electric bus fleet, aiming to reduce emissions by 20% over the next five years.
- In October 2025, Heliox introduced a modular charging system with V2G functionality, allowing buses to return energy to the grid, tested in European pilot projects.
How Does Regional Analysis Impact the Electric Bus Charging Station Market?
- Asia Pacific to dominate the global market.
Asia Pacific, valued at USD 2.11 billion in 2025 and projected to reach USD 21.41 billion by 2035 at a CAGR of 26.1%, dominates with over 50% revenue share due to extensive electric bus adoption in China, where government policies mandate zero-emission fleets in major cities, supported by massive subsidies for infrastructure totaling billions annually; India contributes through rapid urbanization and initiatives like FAME III, while Japan and South Korea focus on technological innovations in wireless charging; China as the dominating country leverages its position as the world’s largest EV market, with over 500,000 electric buses and integrated smart city projects that prioritize sustainable transport, driving regional leadership through scale and policy alignment.
Europe demonstrates robust growth, propelled by the EU’s Green Deal and mandates for alternative fuels infrastructure by 2025, with countries investing heavily in pantograph and depot systems; collaborations between manufacturers and utilities enhance grid integration, and emphasis on cross-border charging networks supports seamless transit; Germany emerges as the dominating country with its Energiewende policy, leading in high-power chargers and public-private partnerships that accelerate fleet electrification in cities like Berlin and Munich.
North America advances steadily, fueled by federal programs like the Infrastructure Investment and Jobs Act allocating billions for clean transit, alongside state-level incentives in California; focus on V2G technology and resilient infrastructure addresses grid challenges; the United States dominates with initiatives in states like New York and California, where over 5,000 electric buses are operational, backed by EPA grants and utility upgrades for sustainable urban mobility.
Latin America emerges gradually, driven by pilot projects in megacities and international funding for green transport; economic incentives for fleet operators offset initial costs; Brazil leads as the dominating country with Sao Paulo’s commitment to electrify 2,000 buses by 2030, supported by World Bank loans and local manufacturing incentives.
The Middle East and Africa progress incrementally, influenced by oil diversification strategies and urban development plans; investments in solar-integrated chargers align with renewable goals; the United Arab Emirates dominates through Dubai’s RTA plan for 1,000 electric buses, integrating charging with smart city infrastructure and sustainability targets for Expo legacies.
Who are the Key Market Players in the Electric Bus Charging Station Market?
ABB Ltd. ABB Ltd. develops high-power DC fast chargers for bus fleets, with strategies emphasizing grid integration and modular designs; the company pursues global partnerships with transit authorities to deploy pantograph systems, focusing on energy efficiency and scalability.
Siemens AG. Siemens AG offers comprehensive charging solutions including overhead pantographs, strategizing through digital twins for infrastructure planning; it collaborates with utilities for smart grid compatibility, targeting urban electrification projects.
Heliox Energy. Heliox Energy specializes in opportunity charging systems, with strategies involving rapid deployment kits; the company invests in V2G technology to enable bidirectional energy flow, enhancing fleet economics.
ChargePoint Inc. ChargePoint Inc. provides networked chargers with cloud management, employing subscription models for software updates; it expands through acquisitions and focuses on interoperability for multi-vendor fleets.
Proterra Inc. Proterra Inc. integrates charging with its bus manufacturing, strategizing vertical supply chains; the company emphasizes depot solutions with AI optimization for energy costs.
Ekoenergetyka – Polska S.A. Ekoenergetyka – Polska S.A. focuses on ultra-fast chargers, with strategies including EU-funded R&D for wireless tech; it targets Eastern European markets with customized installations.
Electreon Wireless Ltd. Electreon Wireless Ltd. pioneers dynamic wireless charging, strategizing pilot roads for continuous operation; the company partners with governments for infrastructure trials.
Furrer+Frey AG. Furrer+Frey AG excels in overhead charging systems, employing strategies like lightweight designs for urban integration; it serves European transit with maintenance services.
JEMA Energy SA. JEMA Energy SA offers power conversion for chargers, with strategies focused on high-efficiency modules; the company collaborates on renewable integrations.
Alstom SA. Alstom SA provides turnkey charging infrastructure, strategizing through rail-synergies for multi-modal hubs; it invests in sustainable materials for long-term durability.
What are the Market Trends in the Electric Bus Charging Station Market?
- Rising adoption of wireless and inductive charging for seamless operations without physical connections.
- Integration of smart grid and AI for optimized energy management and predictive scheduling.
- Growth in ultra-fast chargers exceeding 450 kW to minimize fleet downtime.
- Emphasis on renewable energy integration, including solar-powered stations.
- Expansion of V2G capabilities allowing buses to supply power back to the grid.
What Market Segments and their Subsegments are Covered in the Electric Bus Charging Station Report?
By Charging Type
-
- Depot Charging
- Opportunity Charging
- Inductive Charging
- Pantograph Charging
- Overhead Charging
- Ground-Based Charging
- Wireless Charging
- Fast Charging
- Slow Charging
- Battery Swapping
- Others
By Charger Type
-
- Off-Board
- On-Board
- Portable Charger
- Fixed Charger
- Smart Charger
- DC Charger
- AC Charger
- Combined Charger
- Level 1 Charger
- Level 2 Charger
- Others
By Power Output
-
- Less than 50 kW
- 50-150 kW
- 151-450 kW
- More than 450 kW
- Ultra-Fast >500 kW
- Low Power <20 kW
- Medium Power 20-100 kW
- High Power 100-300 kW
- Megawatt Charging
- Solar Integrated
- Others
By Region
-
- North America
- U.S.
- Canada
- Europe
- UK
- Germany
- France
- Rest of Europe
- Asia Pacific
- China
- India
- Japan
- Rest of Asia Pacific
- Latin America
- Brazil
- Mexico
- Rest of Latin America
- Middle East & Africa
- UAE
- South Africa
- Rest of Middle East & Africa
- North America
Chapter 1. Preface
Chapter 2. Executive Summary
Chapter 3. Global Electric Bus Charging Station Market - Industry Analysis
Chapter 4. Global Electric Bus Charging Station Market- Competitive Landscape
Chapter 5. Global Electric Bus Charging Station Market - Charging Type Analysis
Chapter 6. Global Electric Bus Charging Station Market - Charger Type Analysis
Chapter 7. Global Electric Bus Charging Station Market - Power Output Analysis
Chapter 8. Electric Bus Charging Station Market - Regional Analysis
Chapter 9. Company Profiles
Frequently Asked Questions
Electric bus charging stations are specialized infrastructure facilities equipped with chargers to replenish the batteries of electric buses, supporting various technologies like depot, opportunity, and wireless charging for efficient public transport.
Key factors include government subsidies for green transit, advancements in fast-charging tech, urbanization increasing bus fleets, and regulations mandating zero-emission vehicles.
The market is projected to grow from USD 4.21 billion in 2025 to USD 42.81 billion by 2035.
The CAGR is expected to be 26.1% during 2026-2035.
Asia Pacific will contribute notably, holding 50% share, driven by massive deployments in China.
Major players include ABB Ltd., Siemens AG, Heliox Energy, ChargePoint Inc., Proterra Inc., and Ekoenergetyka – Polska S.A., among others.
The report offers detailed insights on market size, forecasts, segmentation, dynamics, regional analysis, key players, trends, and strategies.
The value chain includes component manufacturing (chargers, cables), system integration, installation and deployment, network management software, maintenance services, and end-user operations.
Trends favor wireless charging and smart systems, with preferences shifting towards sustainable, efficient solutions that integrate renewables and minimize downtime.
Regulations like EU's Green Deal and emission standards drive adoption, while environmental factors include the push for reduced urban pollution and carbon neutrality goals.